12 December 2019 at Sensory Dimensions, Cowlairs, Nottingham, NG5 9RA
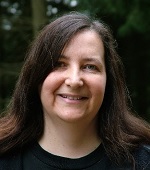
Lauren Rogers, Freelance Sensory Scientist
Lauren Rogers is a freelance sensory scientist living in the beautiful Staffordshire Peak District. Lauren fell in love with sensory science in the early 1990s when she worked for Dalgety Plc, a food ingredients company. Later, she worked for GlaxoSmithKline, mainly on beverages such as Ribena and Horlicks.
As well as working for several different clients on many different product types and many different qualitative and quantitative methods, Lauren also lectures on sensory science at the University of Nottingham. Lauren is particularly interested in the sensory, consumer and emotional attributes of brands; sensory shelf-life; panel performance; and sensory claim substantiation. She has experience in many food products including: ingredients, snack products, drinks and pet-food. She also has experience in home and personal care products such as shampoos, conditioners, toothpastes and creams.
Lauren is a Fellow of the Institute of Food Science and Technology (IFST), a registered sensory scientist (RSensSci) and an active member of the IFST’s Sensory Science Group, maintaining their sensory science qualifications. She is also a member of the Market Research Society, the Sensometrics Society, the Society of Sensory Professionals and the ASTM E-18 (Sensory) Committee.
Find out more about Lauren and her publications about Sensory Panel Management and Discrimination Testing in Sensory Science at www.laurenlrogers.com, and on Twitter: @laurenlrogers.
Abstract: “Do you see what I see?”: even more effective ways to present sensory science data
Advances in technology, software and even better ways to show data mean that we can now more easily create data visualisations that effectively and quickly tell the story we wish to share. But also simply considering existing chart elements such as colours, typeface, legends, additional text etc. can also greatly enhance the communicability of your diagram, infographic or chart.
Examples of improved plots for many types of sensory data, including complex plots such as preference mapping and temporal check all that apply, as well as everyday plots depicting data from panel performance assessments, descriptive analysis and just-about-right data, will be shared with the audience in an entertaining and enlightening way. The audience will leave the talk with quick and simple adjustments they can easily make, along with hints and tips for making reports, presentations and graphics work harder.
Sam Knowles, Founder and Managing Director, Insight Agents
Insight Agents was founded in 2013 by Sam Knowles, who is the Managing Director. Sam combines long and varied consultancy experience with a facility for turning relevant data into narratives that resonate. At Insight Agents, Sam helps companies to craft the most compelling, data-driven stories in their sector. He divides his time between consultancy, writing, and training.
Sam has recently written Narrative by Numbers: How to Tell Powerful & Purposeful Stories with Data, published by Routledge in April 2018 to critical acclaim. This book will be followed by a sequel, How to be Insightful, in Spring 2020, also with Routledge.
Sam holds a doctorate in Experimental Psychology, a source of both his understanding of human motivation and behaviour and his love of telling stories with data. He is a Fellow of the Royal Society of Arts and a member of 26, an organisation that exists to inspire a greater love of words, in business, and in life. Sam is also a member of the Public Relations & Communications Association, the Market Research Society (MRS), and the Public Speaking Association.
He is an experienced and celebrated speaker, giving regular keynotes to many industry sectors, associations, and academic groups. A prolific blogger and accomplished speaker, Sam is a sought-after guest on podcasts. He is the co-founder and co-host of the Small Data Forum, a podcast examining the uses and abuses of data big and small in business, politics, and public life. @samknowles, @insightagents, @NarrativeByNumb
Abstract: Narrative by Numbers
The revolutions in social media and Big Data mean that we live in a world where many more voices matter. Communication is no longer the preserve of a narrow, guarded corporate function. What people think about an organisation is practically shaped by everyone who works for it.
This new reality presents organisations and their leaders with a delicious paradox: it has never been more challenging and yet at the same time never more possible to use data and statistics to tell more powerful, purposeful, and persuasive stories. People make decisions emotionally and justify them rationally, using what psychologist Daniel Kahneman calls System 1 and System 2 thinking. This means that organisational storytellers today can only make themselves heard if they construct narratives that support the emotional with the rational, appealing to both Systems in harmony.
Author, consultant, and master data storyteller Dr Sam Knowles has quite literally written the book on how best to use data as the rational underpinning to emotional storytelling: 2018’s critically-acclaimed Narrative by Numbers from Routledge. In this provocative and interactive session, Sam sets out the six Golden Rules of great data storytelling. He argues that judicious use of statistics in stories is more about empathy and insight than analytics. This is because truly impactful, data-driven narratives demand that organisations talk that most-refined and rare corporate dialect, Human.
Charlotte Austin, Communication Coach and Behavioural Therapist
Before she founded her businesses Charlotte was a journalist, producing compelling stories for the BBC. As part of a team who won Sony Gold Award’s for their work, Charlotte has acquired valuable skills as a story teller, which she now shares with her coaching clients today.
With over 10 years’ experience in the industry, she has worked with both whole teams and individuals at an executive level at global brands such as Apple, Google, Facebook, AKQA, Channel 4, The Independent and Metro among others including Fortune 500 companies such as JP Morgan Chase & Co and Starwood Hotels & Resorts. Charlotte is a primary practitioner for the Association of Business Psychologists, and has a certificate in Cognitive Behavioural Therapy from The British Psychology Society. She is also a member of The Association for Coaching, and is a renowned public speaker with regular keynote spots at high profile industry events. Her written work has featured in publications such as Women’s Fitness Magazine, Huffington post, Cosmopolitan Magazine and Balance Magazine.
Abstract: Engaging an audience emotionally as well as intellectually is the secret to impactful storytelling.
In this speech Communication Coach Charlotte Austin teaches us how to cause a chemical reaction in your audiences bodies that will keep them hanging on your every word. Using hearts as well as minds to connect and convince.
She tells us how to weave more meaning into our message, as-well-as how to deliver data to in an interesting way.
If you want to learn how to keep people engaged and get them to take your advice and turn it into action, then this talk is for you.

