This document is Appendix 1 for the Information statement on How to Choose and Instruct a Laboratory
Analytical method performance characteristics
Based on Article 34 (4) referencing ANNEX III, to Regulation (EU) 2017/625 on official controls.
See Commission Decision 2002/657/EC of 12 August 2002 implementing Council Directive 96/23/EC, concerning the performance of analytical methods and the interpretation of results.
|
|
Performance characteristics |
Definition* and comments |
Comments and observations on how the performance characteristic may be assessed |
|
a |
Bias Accuracy (trueness and precision) |
Although the Regulation cites the italicised terms, ‘bias’ is the preferred term. Measurement bias, or bias, is an estimate of a systematic measurement error. It can be visualised as the difference between the mean of a set of measurements and a ‘true’ reference value.
VIM: ‘Accuracy’ is defined as the closeness of agreement between a measured quantity value and a true quantity value of a measurand [that which is measured] however it is not a numerical quantity. A measurement is said to be more accurate when it offers a smaller measurement error. Under current ISO definitions accuracy is a property of a single result and as such is influenced by both random effects (precision, see below) and systematic effects (trueness). Trueness, which is not a synonym for accuracy, is the closeness of agreement between the average of an infinite number of replicate measured quantity values and a reference quantity value |
Initially assessed in the Validation Study, from the analysis of reference materials (RM), certified if possible (CRM) and/or by spike and recovery experiments [see (g) ‘Recovery’] Monitored as part of ongoing quality control. Validation is a structured study of the overall performance of an analytical method, providing objective evidence that it fulfils specified requirements. This is one of the requirements of accreditation to ISO/IEC 17025 ‘General requirements for the competence of testing and calibration laboratories’ Examples of bias include:
|
|
b |
Applicability (matrix and concentration range) |
Better described as ‘working range’. The required matrices, analytes and concentration range should be specified in the analytical standard operating procedure |
Validation study to check the method can meet the analytical requirement. Acceptable method performance across the range of analyte levels and sample matrices required. Instrument calibration curve must cover the range of concentrations of interest with adequate linearity or follow a known non-linear function. Monitored as part of ongoing quality control |
|
c |
Limit of detection (LoD) |
A measured quantity for which the probability of falsely claiming the absence of a component in a material is ‘β’, given a probability ‘α’ of falsely claiming its presence. Default values for ‘α’ and ‘β’ are usually both 0.05 The term “sensitivity” is discouraged for ‘detection limit’ |
Validation study, assessed from repeat analysis of blank, or near blank, samples as a multiple (usually between 3 and 5) [‘Terminology … ’ explains why a multiplier of 3.3 is statistically valid] of the standard deviation, to optimise avoidance of false positives (α error) and false negatives (β error). Signal to noise ratios of 3 are also commonly used to estimate LoD. The aim of the LoD is the concentration at which a user of the data can be confident (within defined limits), that the target analyte has been detected and the method used can distinguish this from a ‘blank’ response. Monitored as part of ongoing quality control |
|
d |
Limit of quantification (LoQ) |
The lower limit of the working range (‘Terminology…’, not defined in VIM) Informally LoQ can be regarded as the concentration at which the target analyte can be quantified, with a given statistical probability |
Validation study, assessed from repeat analysis of blank, or near blank, samples as a multiple (usually 10) of the standard deviation. Signal to noise ratios of 10 are also commonly used to estimate LoQ. Both LoD and LoQ must be sufficiently below any applicable regulatory, or specification limit, to assure confidence - usually by a factor of 10, if possible Monitored as part of ongoing quality control |
|
e |
Precision |
The dispersion of results, closeness of agreement between measured values obtained by replicate measurements on the same, or similar sample under specified conditions. Usually expressed by measures of imprecision, such as standard deviation, variance, or coefficient of variation under the specified conditions of measurement |
Measured by making repeat measurements on the sample under given conditions and calculation of the standard deviation (see below) Must be monitored as part of ongoing quality control Laboratories must be able to report a suitable measure of imprecision and should be encouraged to do so routinely (see below). |
|
e(i) |
Repeatability |
Precision under repeatability conditions |
Dispersion within a laboratory: same analyst, same instrument, same day |
|
e(ii) |
Intermediate precision |
Precision under user defined repeatability conditions, to reflect batch to batch variability, hence repeat measurements over a given time period |
As above but over multiple days, or by different analysts or, less usually, different instruments |
|
f |
Reproducibility |
Precision under reproducibility conditions and measurements in different laboratories, which means in different locations, by different operators with different equipment and at different times |
Dispersion between laboratories – assessed, for example by a collaborative study (ring trial) |
|
g |
Recovery |
Proportion of the amount of analyte present in, or added to, the analytical portion of the test material, which is extracted and presented for measurement |
Addition of a known amount of analyte to a sample (spiking) and then deciding what percentage is determined. Recoveries of 80 to 120% are usually acceptable. The acceptable range increases with decreasing concentration. There are criteria in legislation for adequate recoveries, as a function of concentration for contaminants[1] Reported results may, or may not, be corrected for recovery. Practice differs, but analytical reports should clarify if data is recovery corrected, and the validation study will contain recovery data |
|
h |
Selectivity |
Selectivity refers to the extent to which the method can be used to determine particular analytes, in mixtures or matrices, without interferences from other components of similar behaviour (IUPAC 2001) |
Selective for the target analyte, and not subject to interferences by either the sample matrix or other analytes. The use of the term ‘specificity’ for the same concept is to be discouraged. Examination of chromatograms, spectra and scrutiny of recovery data and analysis of RM and CRM. The possibility of isobaric interferences in mass spectrometry should be borne in mind |
|
i |
Sensitivity |
The slope of the (linear) calibration curve; the change in analytical response, as a function of a change in analyte concentration (see Figure 1) |
The term ‘sensitivity’ is often used when what is intended is more properly described as ‘detection capability’. Highly sensitive methods display greater changes in response, for a given change in analyte concentration, than low sensitivity methods (see Figure 1), giving more confidence in determination of low concentrations |
|
j |
Linearity |
A direct and unambiguous relationship between analytical response and concentration [see Figures 2(a) & 2(b)] |
While the ideal calibration curve would look like the upper line in Figure 1. Figure 2(a) illustrates that only a portion of the curve may be approximately linear, and at high analytical responses the imputed concentration can be ambiguous; see Figures 2(a) and 2(b). Hence it is necessary to be aware of the ‘linear range’ of the calibration and ask whether it is appropriate to the analysis required. Are you looking for (or is the laboratory offering) results at percentage or mg/kg levels? Linearity can be assessed by a linear regression function, with R2 ≥ 0.98 |
|
k |
Measurement uncertainty |
A parameter associated with the measurement result that characterises the range of values reasonably associated with the measured quantity |
For more information, see section on measurement uncertainty below.
|
|
l |
Other criteria, as required |
This is an undefined ‘catch all’ term that may need careful consideration in non-routine situations, or for emerging techniques (particularly in molecular biology), that may be somewhat removed from traditional analytical chemistry |
A common example would be ‘robustness’ (also known as ‘ruggedness’): the extent to which inadvertent changes in experimental conditions, such as temperature, duration (for example, mixing, extraction, incubation or reaction) are tolerated by the method, without significant impact on the data quality |
Measurement uncertainty
Excluding gross errors, such as instrument failure during the analytical run, two error processes can be described - random and systematic. Random errors contribute to the dispersion of results, to a greater or lesser extent, on either side of the mean. Systematic errors cause results that are always either too high or too low, with respect to the ‘true’ result. Random errors affect precision and are dealt with by assessing repeatability, intermediate precision and reproducibility. Bias provides an estimate of the systematic errors. A significant bias can sometimes be addressed through modification of the analytical process. In some cases, correction for a known bias can be applied, but it should be noted that the correction will have an associated uncertainty. For a completely new method, possible bias should be particularly carefully considered in the method validation.
The fundamental measure of the possible spread of results, either side of the mean, is the ‘standard deviation’ (s), which is the average of the extent to which each individual result differs from the mean. To provide a better estimate of the ‘spread’, a large number of replicate determinations could be made but this would be costly and time consuming. Thus using a small number (≥5) of replicates, when the method is validated, can be statistically treated to yield the ‘confidence interval’[2], at either end of which are the ‘confidence limits’ of the result. This gives the standard uncertainty (u).
Standard text books[3], Eurachem[4] publications and other open access resources, such as Royal Society of Chemistry (RSC) Analytical Methods Committee (AMC) Technical Briefs portfolio (e.g. ‘What causes most errors in chemical analysis?’[5]), can be consulted for further information. Training courses on chemical and bio-analytical method validation, ISO/IEC accreditation and measurement uncertainty are available from various training providers[6].
*For standard definitions, see:
- Bureau International des Poids et Mesures (BIPM), 2021, International Vocabulary of Metrology - Basic and General Concepts and Associated Terms (VIM), 3rd edition
- Eurachem, 2011, Terminology in Analytical Measurement: Introduction to VIM 3 (‘Terminology … ’)
‘x’ axis is arbitrary concentration units; ‘y’ axis is an arbitrary analytical response. For one unit change in concentration, the response of the more sensitive calibration (green bar) is five times greater than the less sensitive calibration (red bar)
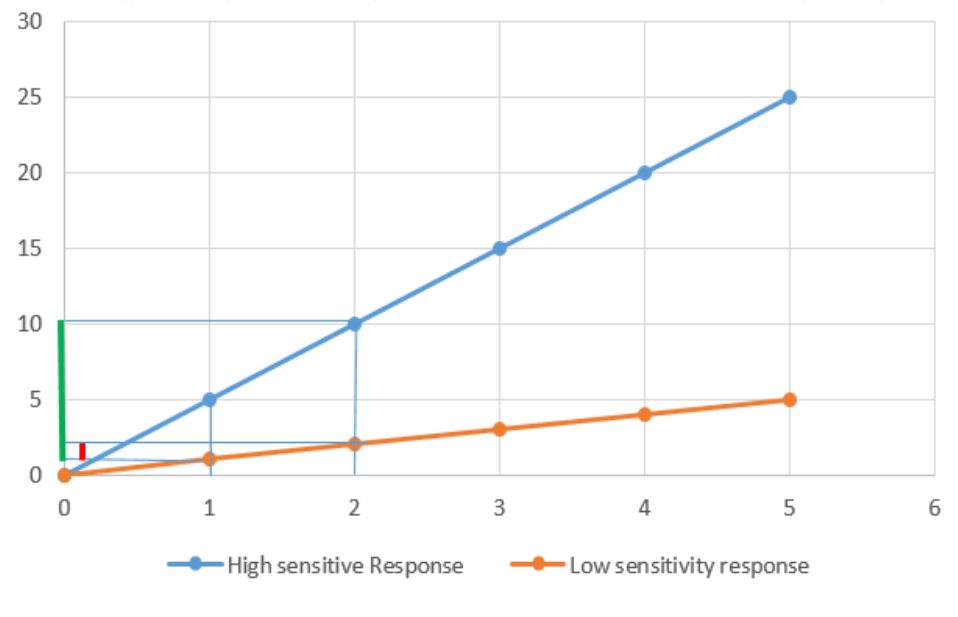
Figure 2(a): Calibration curve
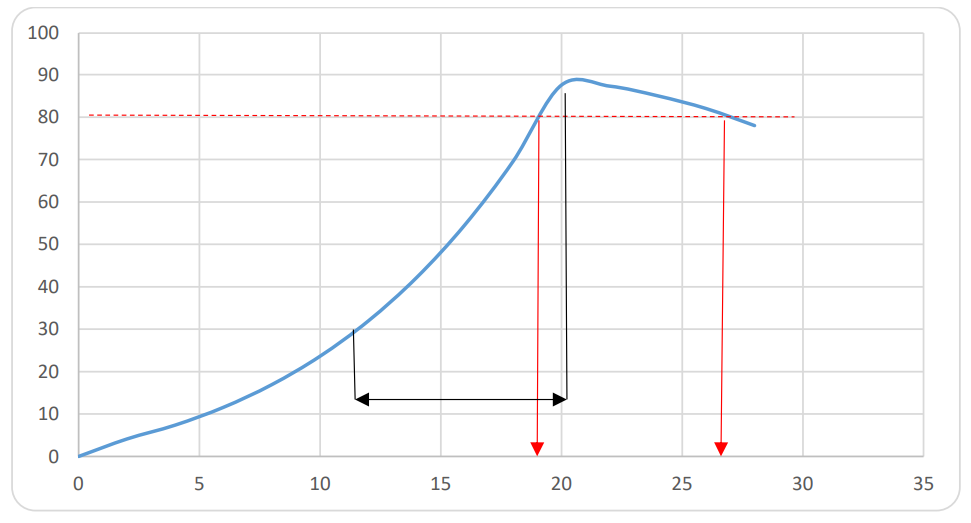
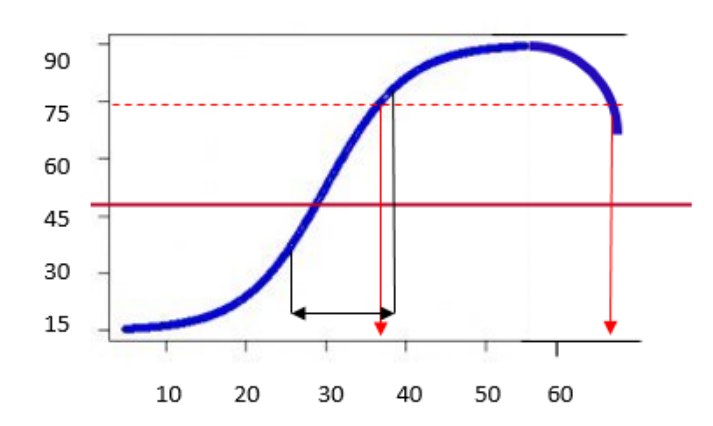
Figures 2(a) and 2(b): ‘x’ axis is concentration, ‘y’ axis is (bio-) analytical response, both arbitrary units for this illustrative example. The arrowed portion indicates the approximately linear interval.
In both examples, only a portion of the curve is approximately linear, and more importantly at high analytical responses the concentration read-out is ambiguous. The red dotted line shows that for the same analytical response on the ‘y’ axis, two different concentrations are possible owing to saturation of the analytical system by the amount of analyte. Figure 2(b) illustrates an extreme example: the ‘hook’ effect in ELISA, particularly ELISA based lateral flow devices.
[1] Commission Regulation (EC) No 401/2006 of 23 February 2006 Laying down the Methods of Sampling and Analysis for the Official Control of the Levels of Mycotoxins in Foodstuffs. Official Journal of the European Union L 70/12, 9.3 22. Also see European Commission ‘Guidance Document for Competent Authorities for the Control of Compliance with EU Legislation on Aflatoxins’
[2] Strictly speaking uncertainty is not a confidence interval, as it does not just deal with random effects
[3] For example ‘Statistics and Chemometrics for Analytical Chemistry’, 7th edition. Miller & Miller, 2018, Pearson Higher Education
[4] Eurachem is a network of organisations in Europe having the objective of establishing a system for the international traceability of chemical measurements and the promotion of good quality practices
[5] RSC Analytical Methods 'What causes most errors in chemical analysis?'